FlowerApp: Design, Simulate and Analyze Your Flowcharts
Background
I have finally graduated from the Istanbul Technical University with a degree in Computer Engineering. I have learned a lot about programming, software architectures, design patterns, the development of quality software and much more.
During my first year, I saw that my classmates who were new to programming, had difficulties implementing algorithms. I wanted to develop a tool that could help them.
After some research, I have concluded that flowcharts are a good way to teach the fundamentals of programming. At that time, I was learning Java and did not know much about tech stacks or how to develop quality software (It was my first year at university.). I used Swing library to implement GUI, and the outcome was not bad, actually. If you want to try that version, please visit GitHub link. It’s a JAR file under the “Releases” tab.
I’ll cut it short, finishing this project has been on my mind for a long time, and I decided to focus on it last year. In the past years, I got more experienced with programming and rewrote the whole project for the web in a modular approach.
Motivation
A flowchart diagram is a representation of an algorithm produced as a solution for a particular problem by visualizing it with various symbols and figures. In this context, flowchart diagrams not only help the reader to gain an understanding of the procedure but also to get an impression of the analytical characteristics of it, such as complexity, cost, frequency of loops and input/output operations, even just by looking at the density of the shapes.
So, reading and/or understanding an algorithm becomes much easier. Also, due to the characteristics of flowchart diagrams, hard to grasp code gems are unlikely to be created. Because a small code fragment will result from a small flowchart and flowcharts are, fundamentally, easy to understand.

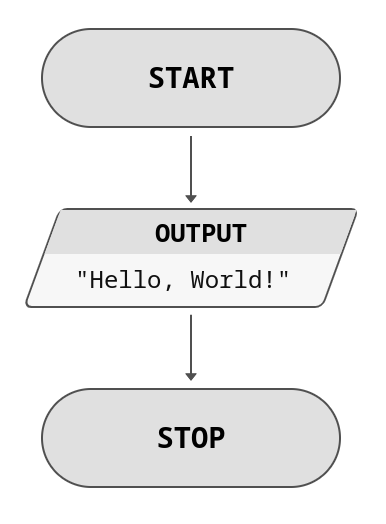
Flowcharts can be used as a visual document to express different aspects of a project. Moreover, by converting flowcharts into pseudo-codes, richer documentation can be written. Below snippet is the pseudo-code of the HelloWorld program above:
begin
  store "Hello, World!"
end
Such pseudo-codes are actually help to realize algorithms in other languages, think about Assembly! After creating and testing the algorithm, the developer can easily translate their program into desired language. Let’s see more complicated example:

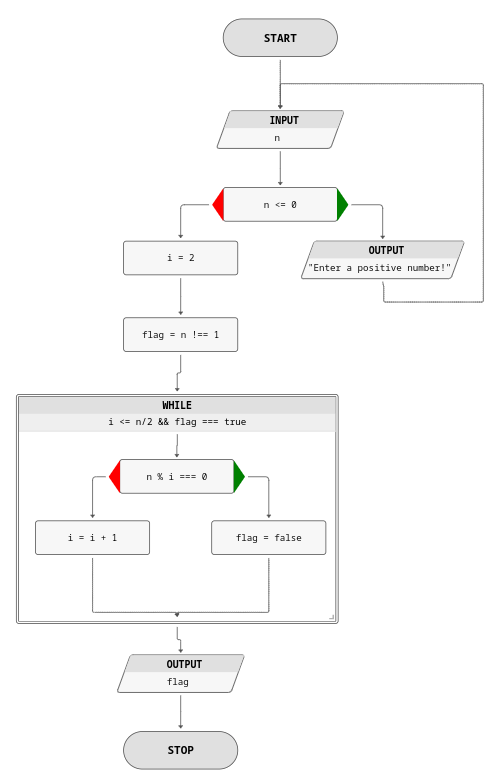
Above diagram checks given number is whether prime or not. As you can see it is very easy to see the steps required to accomplish the task.
PS: If the language does not support while loops, the developer can use conditional loops instead, as illustrated in the first loop.
begin
  load n
  if (n <= 0)
    store "Enter a positive number!"
    goto L2
  fi
  i = 2
  flag = n !== 1
  while (i <= n/2 && flag === true)
    if (n % i === 0)
      flag = false
    fi
    i = i + 1
  wend
  store flag
end
As you can see with the help of pseudo-codes and flowcharts, it becomes easier to understand and adapt the algorithms.
Proposed Solution
The proposed solution is designed as a web application for creating and testing flowchart diagrams. It also has a proof-of-concept pseudo-code compiler that can convert a flowchart into pseudo-code.
The main idea behind deploying a web application is to enable easier access to a wide variety of devices. Furthermore, maintaining and updating the system is much simpler. Since the application has PWA support, it can be installed on a mobile device and can be used offline.
Designing and Exporting
Users can create their flowcharts simply by clicking the related figure and writing simple expressions and statements inside them. After that, blocks are connected by dragging from their connection handles. Finally, by the addition of two symbols that mark the start and the end of the flow, a flowchart can be created.
This created flowchart can be exported
- to a PNG image and saved to a file,
- or to a pseudo-code.
All the snippets and images are from the FlowerApp application.
Testing and Analysis
Users can test their flowcharts by clicking the related figure and clicking the “Run” button. The program will run the flowchart and display the output.
The watch list is also displayed to help to debug the program by seeing the variables and values that are changed.
Moreover, an Analysis window is also added. An example of the analysis window is shown below, for the “is prime” program with input of \(47\).
.png)
For more information about Cyclomatic Complexity.
Open, Save and Share
Application data saved in JSON format. Users can save their flowcharts and share them with others. Just download your work, copy the file to your friend’s computer and open it by selecting the file.
How to Use
Detailed instructions are provided both in-app and How To Page.
Try it out!
Well, as I have explained its a web application, so if you want to give it a try please visit the FlowerApp. I am currently serving the application on my university’s servers.
The GitHub repository is here.
Feel free to contact me if you have any questions, comments or suggestions.